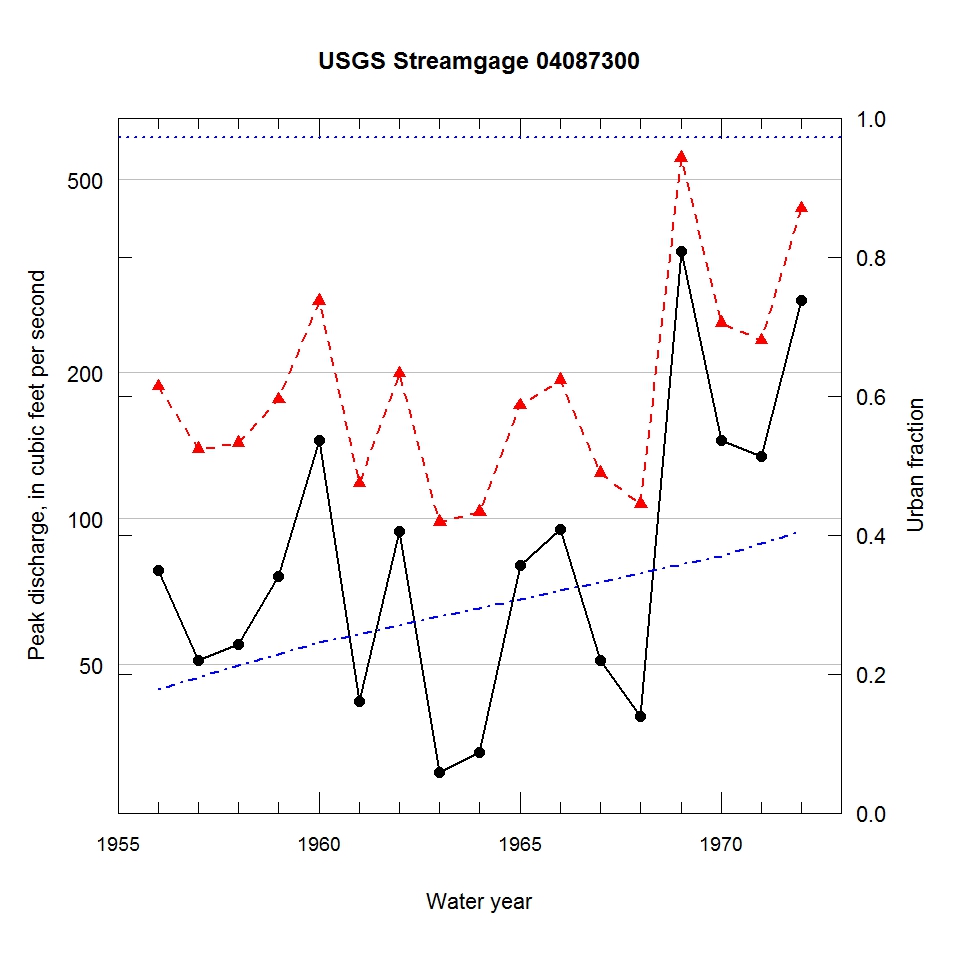
Observed and urbanization-adjusted annual maximum peak discharge and associated urban fraction and precipitation values at USGS streamgage:
04087300 LAKE MICHIGAN TRIBUTARY AT WINTHROP HARBOR, IL


| Water year | Segment | Discharge code | Cumulative reservoir storage (acre-feet) | Urban fraction | Precipitation (inches) | Observed peak discharge (ft3/s) | Adjusted peak discharge (ft3/s) | Exceedance probability |
| 1956 | 1 | -- | 0 | 0.179 | 0.078 | 78 | 187 | 0.454 |
| 1957 | 1 | -- | 0 | 0.195 | 0.661 | 51 | 139 | 0.749 |
| 1958 | 1 | -- | 0 | 0.212 | 0.004 | 55 | 143 | 0.719 |
| 1959 | 1 | -- | 0 | 0.228 | 1.291 | 76 | 176 | 0.516 |
| 1960 | 1 | -- | 0 | 0.245 | 0.930 | 145 | 281 | 0.124 |
| 1961 | 1 | -- | 0 | 0.257 | 0.877 | 42 | 118 | 0.857 |
| 1962 | 1 | -- | 0 | 0.270 | 0.263 | 94 | 199 | 0.389 |
| 1963 | 1 | -- | 0 | 0.282 | 2.390 | 30 | 98 | 0.937 |
| 1964 | 1 | -- | 0 | 0.295 | 2.008 | 33 | 103 | 0.928 |
| 1965 | 1 | -- | 0 | 0.307 | 0.498 | 80 | 171 | 0.547 |
| 1966 | 1 | -- | 0 | 0.320 | 0.867 | 95 | 193 | 0.422 |
| 1967 | 1 | -- | 0 | 0.332 | 0.675 | 51 | 124 | 0.827 |
| 1968 | 1 | -- | 0 | 0.345 | 1.331 | 39 | 107 | 0.913 |
| 1969 | 1 | -- | 0 | 0.357 | 1.629 | 355 | 554 | 0.011 |
| 1970 | 1 | -- | 0 | 0.370 | 1.247 | 145 | 253 | 0.174 |
| 1971 | 1 | -- | 0 | 0.387 | 1.231 | 134 | 233 | 0.222 |
| 1972 | 1 | -- | 0 | 0.405 | 1.674 | 282 | 436 | 0.022 |

